Power Quality Analysis
In order for your business to run efficiently and effectively, you need electricity. If you experience a dip or spike in power, your efficiency suffers, and you run the risk of several other problems. In order to prevent issues and allow your business to perform at its best, you need to implement power quality monitoring (PQM).
Depending on your needs, we can provide stationary and portable measuring instruments, and central software.
Stationary Power quality measurement platforms
ENA-NXG
Based on modular architecture, allowing combination of one CPU module and up to six selected input modules into one meter. The input modules are providing input signal isolation, filtering and A/D conversion, sending the data using digital backplane bus. The CPU module is equipped with FPGA receiving all digital input data, and the real-time controller running meter firmware and providing all interfaces and data storage.
Resulting meter functionality is based on the selected input module type and count, and on the meter firmware.

- U, I, P, Q, S, frequency, THD U, THD I, power factor, energies – AP, AQ, AS, APin, APout, all quantities are per phase and total
- Harmonics – U and I, up to 50, optionally also power harmonics
- All quantitates are calculated on 200 ms (10/12 period basis) according to IEC 61000-4-30
- Voltage quality according to EN50160, IEC 61000-4-30 Class A (U, freq., THD U, flicker, unbalance, harmonics)
- Voltage events according EN50160, IEC 61000-4-30 Class A (dip, swell, interruption – time, extrema, length)
- Waveform capture – in case of trigger, the device captures the waveform
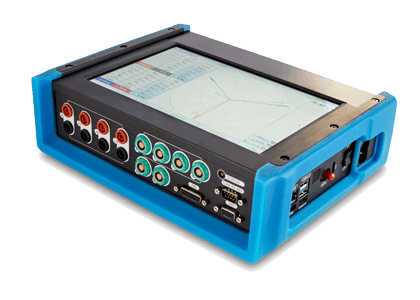
Portable Power Quality Analyzer
The firmware calculates power quality parameters according EN50160 fully follows requirements described in IEC 61000-4-30 Class A and others (61000-4-7, 61000-4-15).

Main measurement functions are:
- U, I, P, Q, S, frequency, THD U, THD I, power factor, energies – AP, AQ, AS, APin, APout, all quantities are per phase and total
- Harmonics – U, I, P, Q up to 50th harmonic, U and I also as 200Hz spectra (0-9kHz) and 2kHz spectra (0-68kHz)
- Symmetrical components – three-phase system de composition into a positive, negative, and zero component
- All quantitates are calculated on 200 ms (10/12 period basis) according to IEC 61000-4-30
- Voltage quality according to EN50160, IEC 61000-4-30 Class A (U, freq., THD U, flicker, unbalance, harmonics)
- Voltage events according EN50160, IEC 61000-4-30 Class A (dip, swell, interruption – time, extrema, length)
- Waveform capture (transients) – in case of trigger, the device captures the waveform
- Disturbances – in case of trigger, the device captures the half-period RMS quantities
- Device is controlled by ENA-Touch application, data is viewed in ENA-Report
Software for Power Quality
ENA-SCADA is distributed system for Power Quality analyzers (PQ). Software can communicate with hundreds of meters, and can support also third party PQ meters.
Main Features
Automatic reading of real-time and historical data
Communication using device specific protocols and formats.
Storage of all historical data into SQL database
All historical data, protocols, supervision records etc. Are stored in the SQL database. Data is not encrypted, and it is also available to other users with sufficient user rights.
On-line data
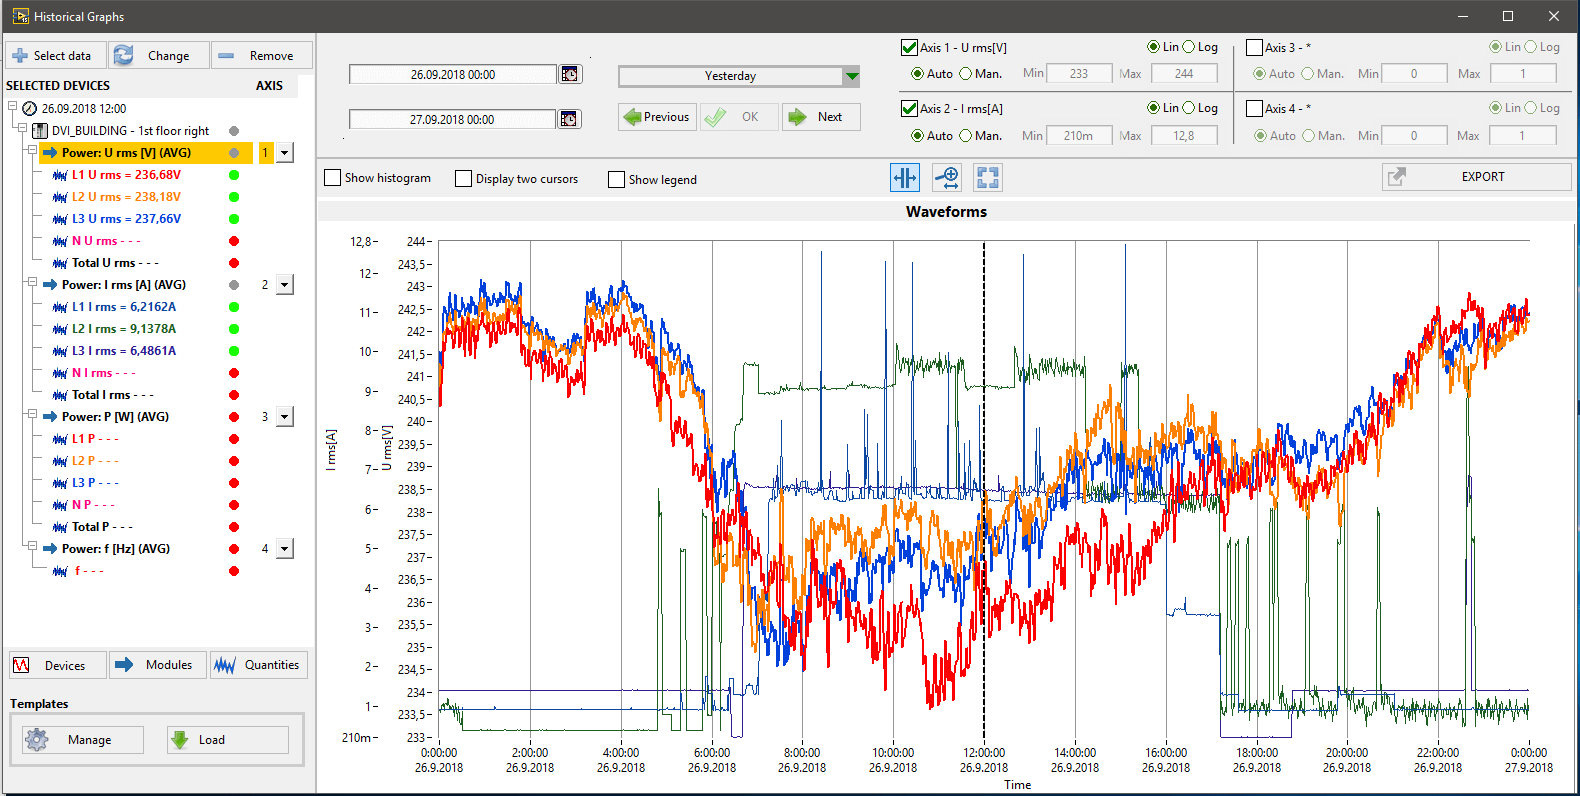
Actually measured quantities are displayed in the table, graph, as V/f profile, vector spectra or on the map.
User is able to view last disturbance or transient including waveform for each measurement system.
It is possible to display values for each phase, and total values also.
Historical data
Archived data are displayed in the graphs, as historical FFT (Spectral display), EN50160 evaluation, energy (hourly/daily), events list, events statistics, reports list.
Geographical visualization
ENA-SCADA provides basic information about actually measured voltage and frequency in the geographical view. User can view all substations/areas where analyzer(s) are installed. Each substation/area shows actual state based on actual voltage level (under/over voltage etc.). Supervision map indicates possible device fault condition.
Reports
User is able to easily export every viewed panel to PDF protocol including basic measurement information. Automatic reports are also available to be configured for events (disturbances and transients).
Notifications
System is able to send notifications automatically and to add a report (if available) under certain circumstances. Sending may be triggered by the event on a device (Voltage Event, Transient record detected) or by the supervision event.
Supervision
The powerful supervisory management monitors each device status and its fault state. Supervision overview distinguishes between two states: OK and Failed. Available function for monitoring are: ping, sw running, data storing, data in the database.
Providing data to other systems
System ENA-SCADA can communicate with other systems, and also can provide its own data to any third party systems – web-service, SQL, MODBUS/TCP.

