Introduction:
Our business and operations systems are more integrated in our new digital era. With accessible data and information, it is easier to enhance the business value of our plants which employ equipment to produce product. When we enhance the equipment performance and availability, we increase production, fundamentally improving plant value.
Rotating equipment plays a vital role in process industries including chemicals, oil & gas, mining, water treatment, and power generation. When our equipment degrades in availability or performance due to a developing defect, we experience production losses in downtime, performance losses, and quality.
We monitor our rotating equipment and systems in our digital era with a wide range of sensors to detect probable equipment defects, automate analytics, and recommend mitigating actions. Automating sensor data collection and analytics improves worker productivity by focusing our workforce on tasks which require human insight and decision making. With automated sensor systems we accrue benefits like lower maintenance costs, less manual data collection, increased equipment lifespan, lower capital costs, increased production output, improved sustainability, reduction in safety incidents, and improved visibility of our equipment health and performance.
Here we focus on the components of a digital predictive & prescriptive maintenance program and application. We describe the process of implementation and share a case study.
Components of Predictive and Prescriptive Digital Maintenance
Application:
There are five categorical components of a digital predictive and prescriptive maintenance application. The five components are listed below and in Image 1.
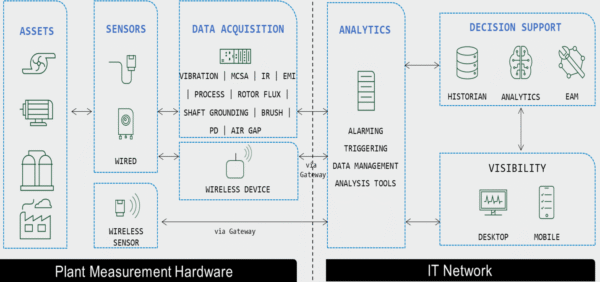
Image 1: Five Components of Digital Predictive Maintenance
- The Asset data includes engineering data and expected performance data like electrical, mechanical, and fluid dynamics; specifications including motor, coupling, driven type (ex. pump, compressor, or fan), and replaceable parts; operating manuals, and recommended periodic preventative maintenance.
- Sensors measure equipment performance and health, connecting our digital systems to the electrical, mechanical, and chemical world of our pumps. Predictive maintenance inspections include vibration, motor current, ultrasonic, thermal, lubrication, electromagnetic, and video sensors. Process sensors include temperature, pressure, flow, and chemical property sensors. The maintenance sensors and process sensors work together, providing a holistic view of the pump operating state, performance, and health.
- Data Acquisition digitizes the electrical signal from analog sensors, transforms digital sensor messages into numerical values, and communicates with the data historian to gather digitized control system sensor data. The data acquisition system adds contextual information like sensor location, time stamps, units of measure, sampling parameters, data quality, operating state, etc.
- Analytics extracts features from sensor data. Features include statistical analysis like rate of change, running averages, and correlations with related pump sensors. Signal processing features like Fourier transforms identify frequencies or tones in vibration, ultrasonic, or electrical sensor data. Sensor features map to pump degradation modes and provide a basis to set alarms and diagnostics.
- Decision Support builds from feature analytics, informing plant personnel of any problem diagnosis with recommended mitigating action. Feature rate of change and alarm levels provide a sense of severity and urgency when failure consequences are put in context. Knowing the plant operational schedule helps personnel target the least interruptive time to perform the mitigating action. At this level, Subject Matter Experts (SMEs) review the recommended action and drill down through the analytics, analyzing raw sensor data and asset information. Feedback from SMEs influences analytics, data acquisition, sensors, and the asset context.
Putting the Components Together:
Implementing a predictive maintenance program starts with the assets. Engineering documentation is fundamental to understand failure physics, performance expectations, failure consequences, and respective mitigating actions.
Core to a predictive maintenance program is an equipment asset catalog, the criticality or importance of assets to the business, probable failure modes, and mitigating actions. These details are kept in an accessible, maintainable, and digital location. The details are navigable by plant equipment hierarchy and by equipment type. Criticality and asset failure modes are most important.
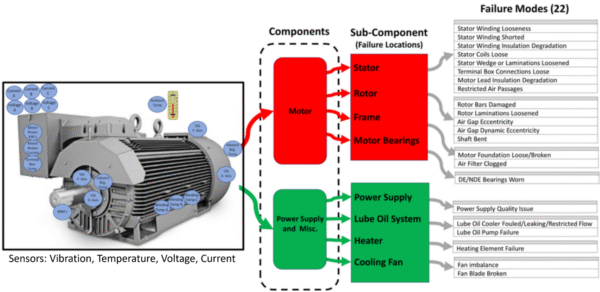
Image 2: Failure Modes of Motor Driver for Pumps, Fans, Compressors, etc.
Knowing the failure modes and typical maintenance plans, a sensor survey identifies existing sensors and any gaps. Sensors are added to improve coverage of probable equipment failure modes.
Data acquisition systems (DAQ) connect wired or wirelessly to sensor sources. Installers configure sensors with location and context including time, units of measure, data quality, etc. DAQs are provisioned on a network of choice, typically a virtual local area network (VLAN) with access to the plant data historian.
The DAQ transfers data to analytics. Analytics calculates features or equipment condition indicators from statistics, correlations, and Fourier transforms. The features combine and provide symptoms of equipment health and performance degradation. The symptoms aggregate and form a probable diagnosis of the equipment’s problem if any,
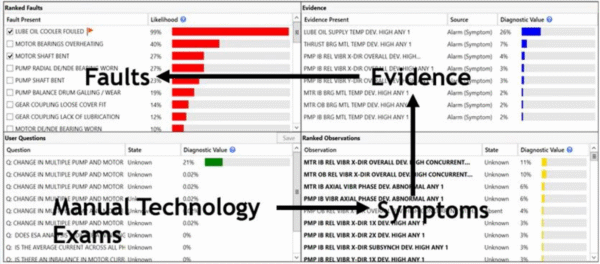
Image 3: Automating Diagnostics using Features and Failure Modes
Decision Support combines the current probabilities in its diagnosis with historical equipment failures with corrective maintenance plans. With the diagnosis and successful actions in hand, the decision support system recommends a mitigating action to remove the defect, curing the equipment of its problem.
Industry efforts combining defect severity and rate of change try to estimate time-to-failure. Image 4. Consider a bearing health curve where vibration and electrical signatures can “see” early signs of wear. Oil analysis offers collaborating symptoms and evidence. Eventually, performance degrades where head-pressure falls, or motor amperage increases. In the future, mitigating action and time-to-failure estimates together ease scheduling of corrective work to a time that is least disruptive to plant operations.
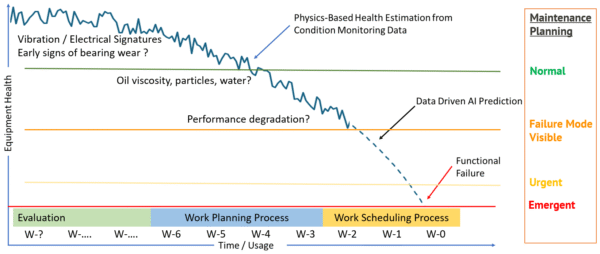
Image 4: Equipment Health with Symptoms and Estimate to Failure
With equipment engineering data, sensor selection, data acquisition, and analytical feature extraction with diagnosis; the digital predictive maintenance system guides plant personnel in planning and scheduling mitigating action. SMEs drill down to engineering documentation, sensor features, diagnostics logic, and original sensor values, to validate and approve recommendations from the decision support software.
Case Study: Largest Power Generation Company in the United States Takes a Digital IIoT Approach for Predictive Maintenance
In 2010, Duke Energy (Duke) began a companywide program using digital technology to address reliability demands and optimize workforce activities [1]. Duke replaced route-based data collection with DAQ technology to identify problems and notify SME specialists. SMEs now remotely spend time on higher value tasks. This multi-year project included new sensors and a new information technology architecture. Duke incorporated the Industrial Internet of Things (IIoT) and big data analytics to meet its reliability goals. Building on maintenance and engineering knowledge of plant assets, Duke worked with the Electrical Power Research Institute (EPRI), sensor vendors, DAQ vendors, data historians, and anomaly detection software. Duke’s vision is for fleetwide Smart Monitoring and Diagnostics (Smart M&D).
EPRI introduced a similar framework to support power generation companies transitioning to IoT-related technologies and solutions. Duke and EPRI work together making investments in online sensors, networking infrastructure, system architecture, and diagnostics applications.
Duke identified over 10,000 assets across their facilities and added more than 30,000 sensors to its equipment including accelerometers, temperature sensors, oil analysis sensors, thermal cameras, and proximity probes. These sensors add online inspections, such as vibration, bearing temperature and oil pressure, transformer dissolved gases, and generator electromagnetic signatures.
Vibration inspections can require captures up to 100,000 samples per second for several seconds to obtain good measures of machine condition. DAQs manage the acquisition, validate data quality, time-stamp data, and extract features. To manage volumes of data, Duke uses edge computers. Every plant has its own data historian that collects, stores, and organizes feature data. SMEs utilize alarm dashboards indicating unexpected equipment behavior and investigate and screen issues to determine whether alarm anomaly needs further investigation. Anomaly data transfers to the decision support system for diagnosis by comparison against known faults in a fault signature database. The diagnosis provides a window to plan and schedule mitigating action at a time when costs are low. Over four years, Duke avoided costs greater than 130% of its capital budget by avoiding unforeseen failures. Further, automated data collection reduces labor costs.
Shifting to a digital predictive maintenance strategy improves reliability and lowers operating costs, meeting corporate reliability objectives while optimizing workforce activities with automation and analytics.
People and process must also be considered. The historic practice of using handheld analyzers for machinery inspections is a SME obstacle. Continuous improvement of remote visualization helps SMEs make the change to Smart M&D. Managing alerts is a challenge when 10,000 assets report anomalies. Incorporating criticality, severity, and risk eases the alarm management challenge.
Duke Energy utilizes change agent leaders in maintenance and reliability areas to advocate for change. Leaders form partnerships with information technology teams and ensure the digital predictive maintenance system is reliable. Executive sponsorship facilitates change management, providing ongoing communications, fleetwide training, and continued funding.
Summary:
Our digital era provides the tools and technologies to integrate engineering data, sensors, data acquisition, sensor feature analytics, statistics, and machine learning into a holistic decision support predictive maintenance system. Implementation teams are grounded in equipment physics, plant production process, stakeholder needs, and business process. It takes a team to deliver a successful implementation incorporating all five key components while managing organizational change.
References:
- “Duke Energy Leverages IIoT for Predictive Maintenance Applications,” IHS Market, Case Study, Alex West, January 2018.